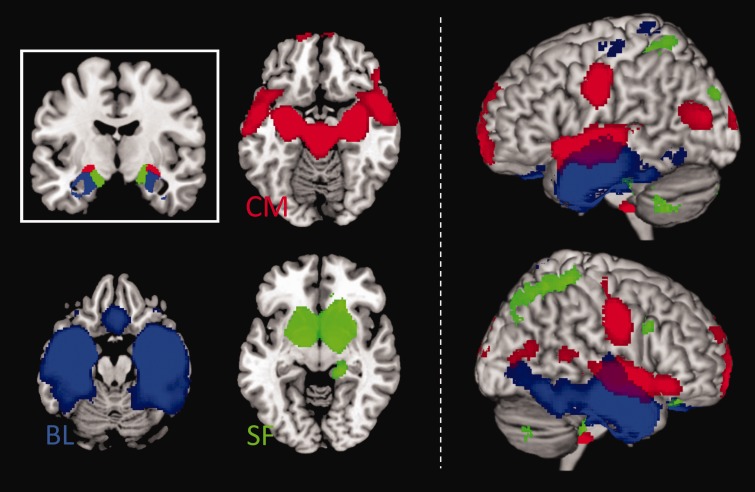
Fig. 2.
FC of amygdala subregions across the entire youth sample. Left: Inset shows anatomically defined bilateral amygdala seed regions: CM (CM; red), BL (BL; blue) and SF (SF; green). Axial slices show brain areas positively correlated with amygdala seed regions. Right: Surface renderings are used to depict separation and overlap of amygdala neural networks. Connectivity maps displayed at P < 0.005, cluster minimum = 10 voxels.

