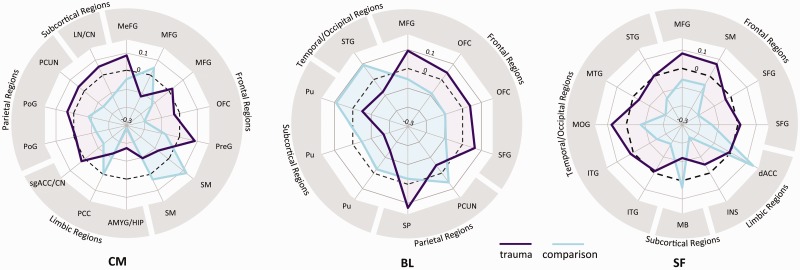
Fig. 3.
Differential patterns of amgydala subregion FC across the whole brain in trauma-exposed (purple) and comparison (blue) youth. Numerical values represent the average within-group correlation strength in areas where groups differed, across frontal, limbic, parietal, subcortical and temporal/occipital regions (coordinates are provided in Supplementary Table S1). Wider area on radial plots in trauma-exposed youth suggests a pattern of enhanced positive FC or diminished negative FC of the amygdala to many brain regions, particularly to areas of the frontal cortex. Dashed line indicates zero; the middle of the plot indicates negative values. Abbreviated brain regions are defined in Supplementary Table S1.

