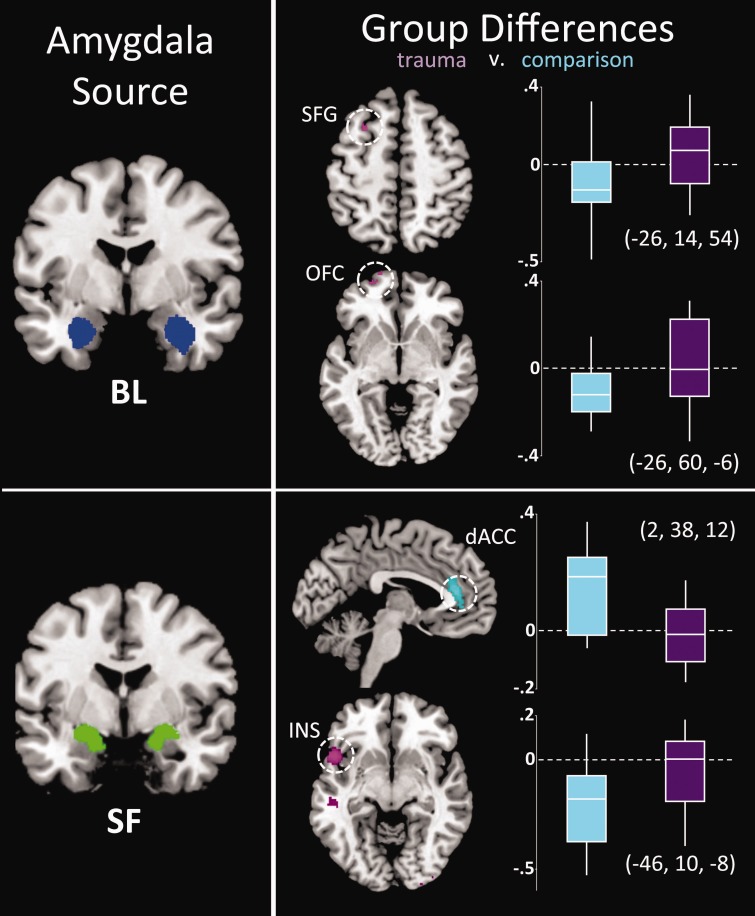
Fig. 4.
Regions showing group differences (trauma, purple; comparison: blue) in FC with BL and SF amygdala. Right: Tukey’s boxplots depict connectivity values by group. The middle line indicates the median, vertical line the range and the limits of the box represent upper and lower quartiles. Corresponding MNI coordinates of peak group difference (Supplementary Table S1) are indicated adjacent to each boxplot. Results are shown at P < 0.005, cluster minimum = 10 voxels, for display purposes.

