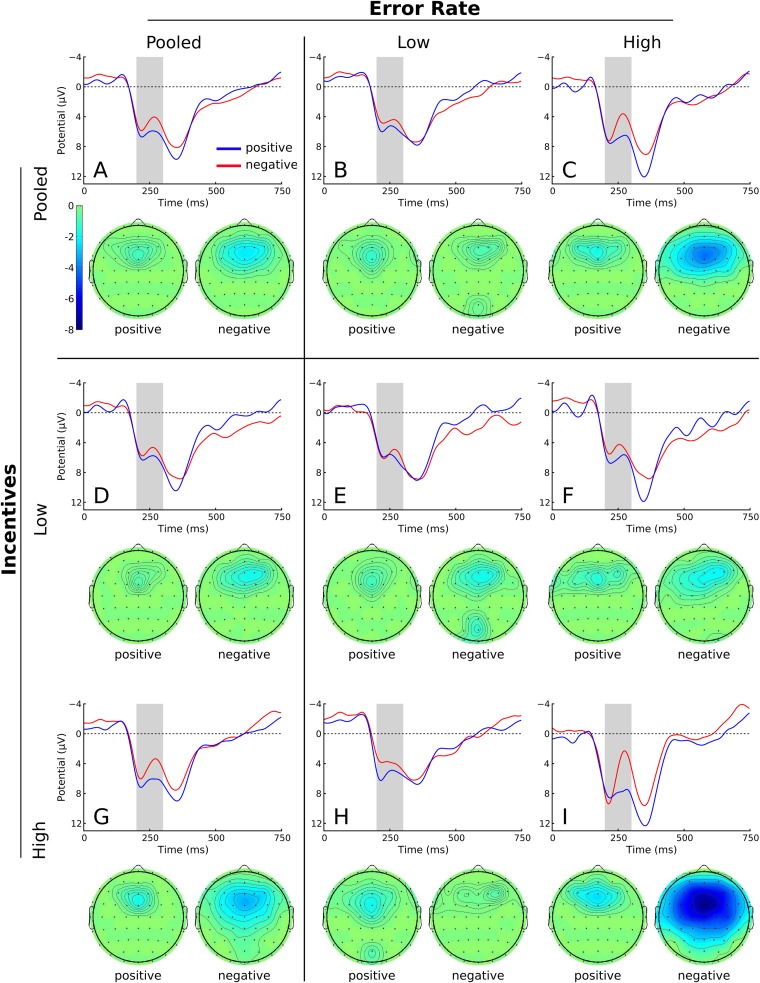
Fig. 3.
Grand-average FRN as a function of feedback valence on the first draw, and corresponding topographies in Study 1. The nine panels correspond to the possible combinations of incentives (high, low, pooled) and reinforcement error rates following a median split (high, low, pooled). Waveforms were filtered (0.1/15 Hz) for presentation.

