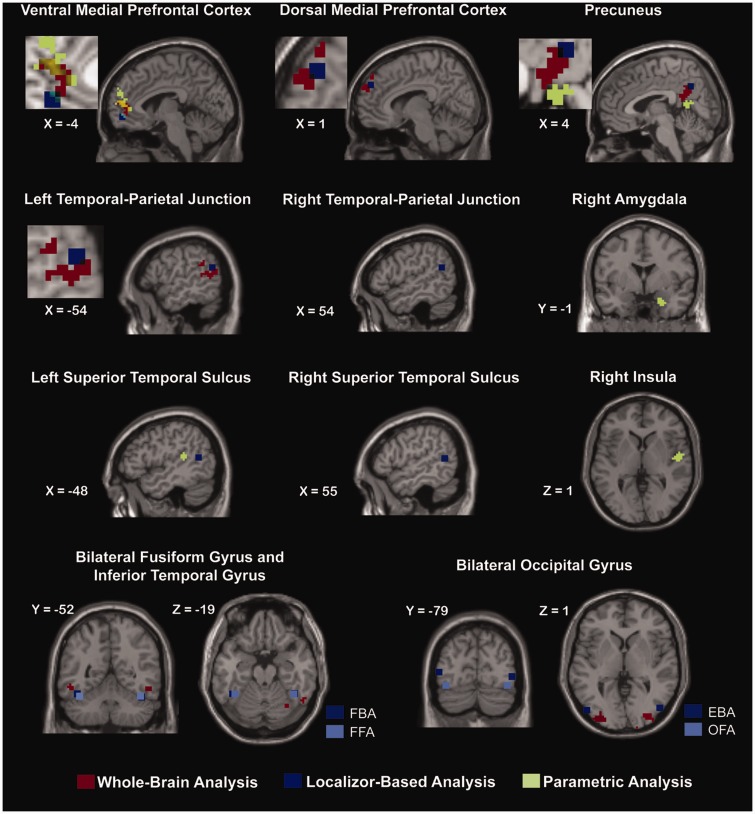
Fig. 4.
Neural activity as revealed by the three different analyses. Localizer-based regions of activity are displayed as 9 mm cubes plotted around the average peak MNI coordinate across all participants. Note that partial overlap was observed across at least two of the three analyses in the VMPFC, the DMPFC, the PrC, and the left TPJ.

