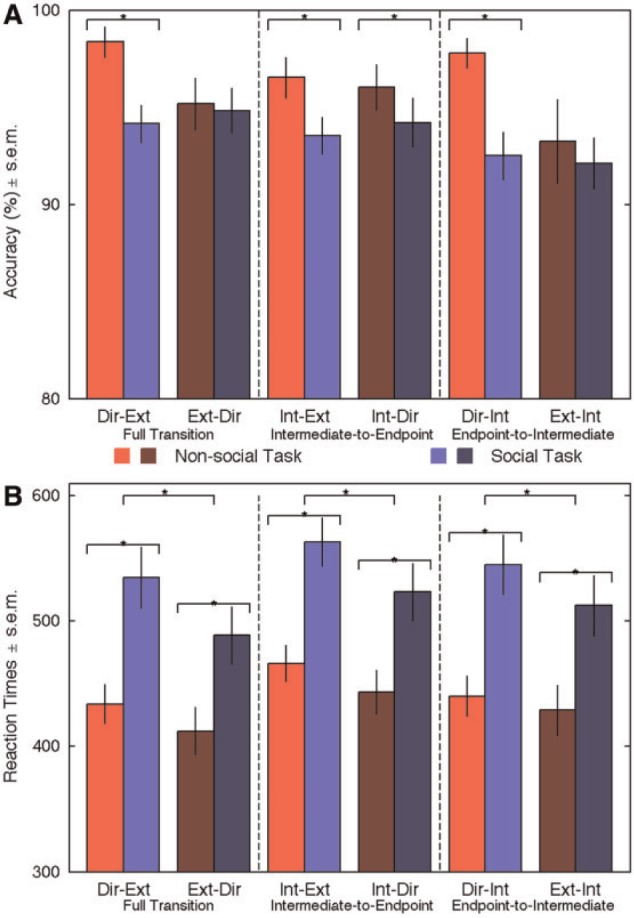
Fig. 2.

Behavioral results. Red bars: non-social task; blue bars: social task. Light colored bars illustrate gaze transition made away from the subjects. Dark colored bars highlight transition made toward the subjects. Error bars represent standard error of mean (SEM). (A) Accuracy. *P < 0.05. Note that accuracy is plotted between 80 and 100%. (B) RTs. *P < 0.01.
