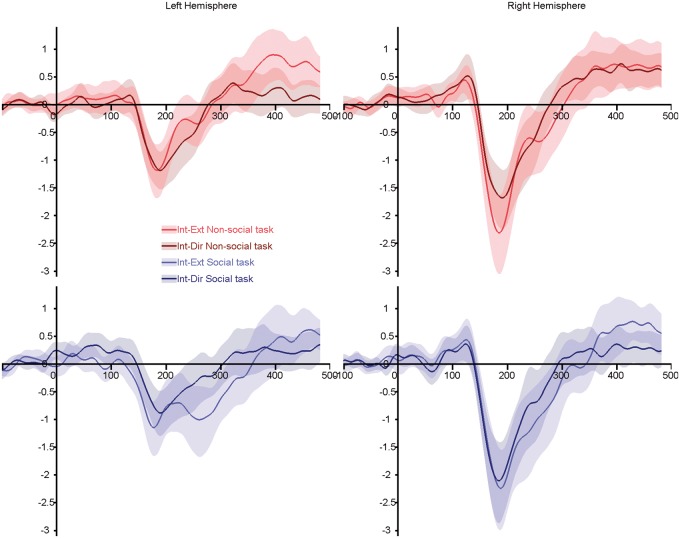
Fig. 4.
Grand average ERPs for the intermediate-to-endpoint transitions (IE and ID—conditions similar to Conty et al. (2007)). Top panels, red lines: non-social task; bottom panels, blue lines: social task. Light colored lines illustrate gaze transition made away from the subjects. Dark colored lines highlighted transition made toward the subjects. Shaded areas represent the 95% confidence interval built using bootstrap (n = 1000) with replacement of the data under H1.

