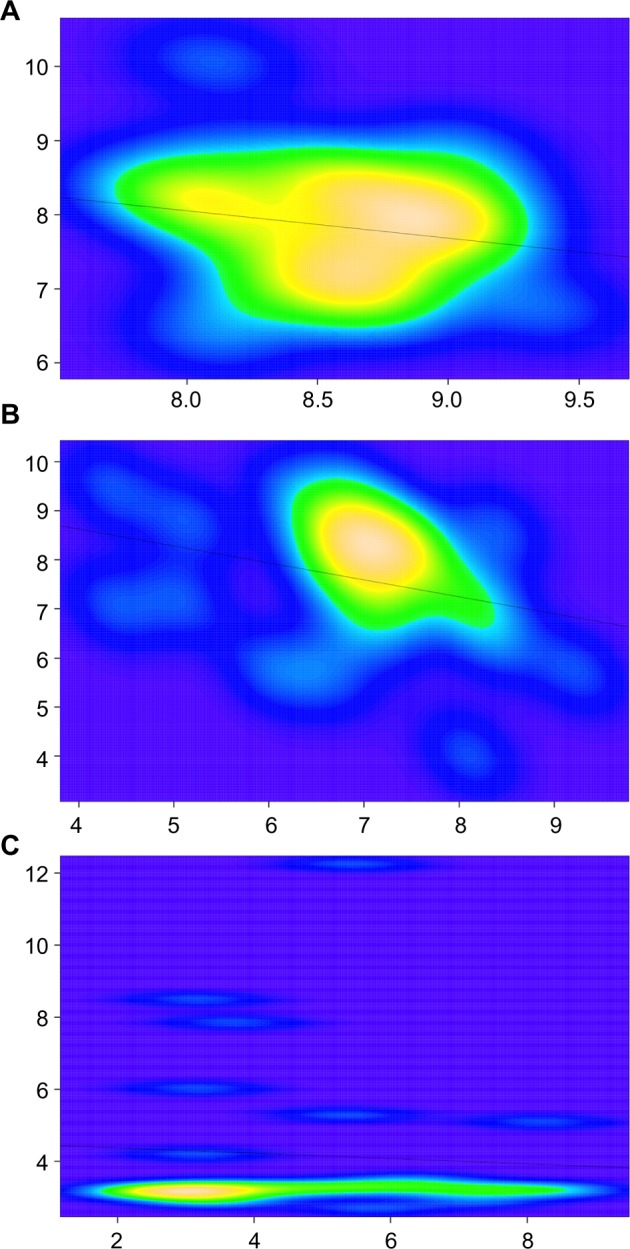
Figure 3.

Bivariate kernel density estimates of gene expression consistency across small-size cohorts. Genes tested were LSD1 (A), EZH2 (B), and CXCR4 (C). x and y axes represent Log2 expression values of given genes (xi or yi) across Ewing’s sarcoma data sets either in GDS# GSE7007 (x axis; n = 27) or in ArrayExpress data set E-MEXP-1142 (y axis; n = 27). Lines across graphs depict regression curves as computed in a multiple regression model based on the ordinary least squares method as defined by the equation .
