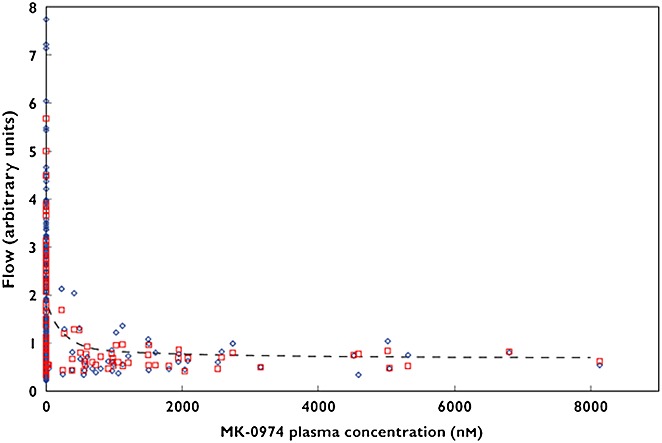
Figure 4.

Capsaicin induced dermal blood flow (CIDBF) vs. telcagepant (MK-0974) plasma concentration. The blue diamonds show the measured DBF, red squares show the individual predicted values and the dashed lines indicate the population predicted means values. Figure4 is adapted, with permission, from Sinclair et al. 38
