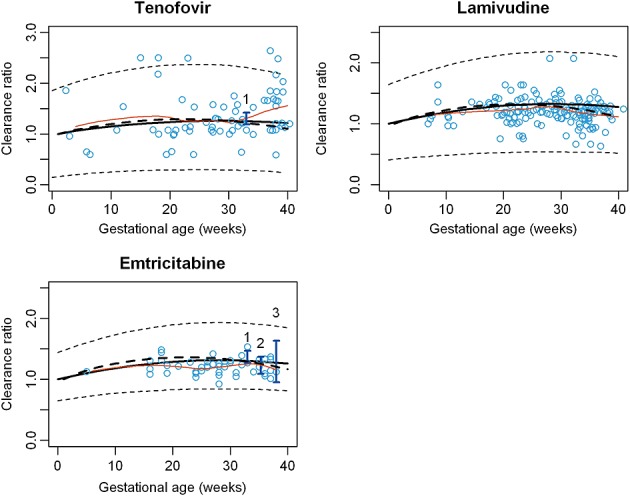
Figure 4.

Evolution of clearance throughout pregnancy. Clearance ratio = Cpregnant women: CLnon pregnant women. o Points represent individual clearances obtained by PopPK analyses 25,26,41, I vertical lines represent confidence interval of observed clearances obtained for given mean GA 23,42,43, and the orange line the spline of individual clearance.  mean predicted clearance ratio (GFR),
  mean predicted clearance ratio (GFR + renal blood flow),
  predicted IP,
  spline,
  population PK data, 1 Data form Colbers et al. 42, 2 Data from Stek et al. 43, 3 Data from Hirt et al. 23
