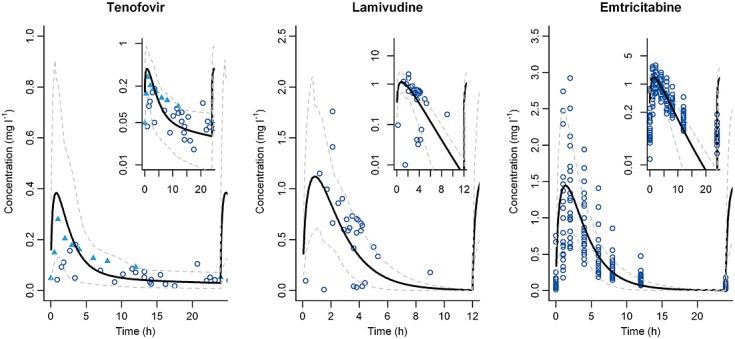
Figure 5.

PK profiles in pregnant women 25,26,42,43. Left: Mean simulated tenofovir PK profile (black bold line) and 95% confidence interval (grey dashed line) obtained for a gestational age of 33 weeks (n = 19) compared with observed concentration from Benadoud et al. 26 (blue circle) and Colbers et al. 42 (blue filled triangle). Log scale figure in the top right corner. Middle: Mean simulated lamivudine PK profile (black bold line) and 95% confidence interval (grey dashed line) obtained for a gestational age of 29 weeks (n = 40) compared to observed concentration from Benadoud et al. 25 (blue circle). Log scale figure in the top right corner. Right: Mean simulated emtricitabine PK profile (black bold line) and 95% confidence interval (grey dashed line) obtained for a gestational age of 33 weeks (n = 26) compared with observed concentration from Valade et al. 41 (blue circle). Log scale figure in the top right corner
