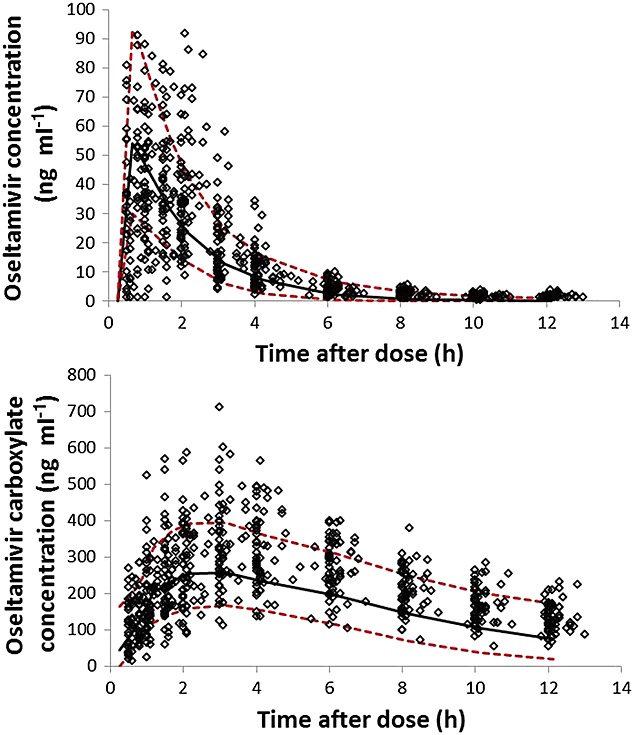
Figure 6.

Predictive performance of the final model was analyzed using visual predictive check plots. The model predicted concentrations of oseltamivir (top) and oseltamivir carboxylate (bottom) were shown as 5, 50 and 95 percentiles lines and were plotted against observed concentrations at each time after dose.  5th and 95th percentile,
  50 percentile (median),
  Observants.
