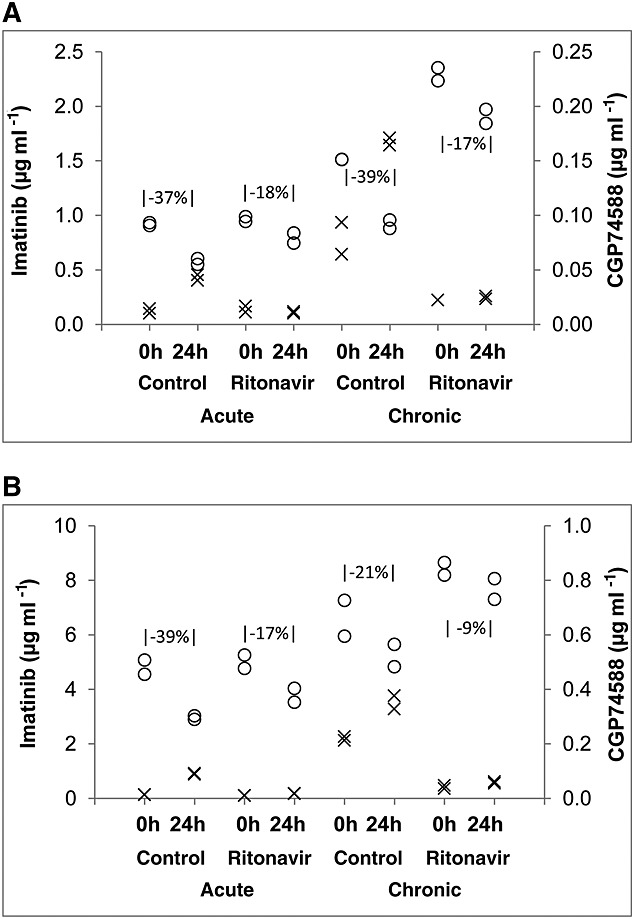
Figure 3.

Imatinib depletion and formation of desmethyl imatinib (CGP74588) in primary cultures of human hepatocytes treated with either DMSO or ritonavir simulating acute and chronic imatinib exposure at 2.5 μm [A] or 10 μm [B]. Decrease in imatinib between 0 and 24 h is indicated in the graphs. The open circle (○) indicates imatinib depletion and the cross (x) represents the formation of desmethyl imatinib
