
Figure EV4.
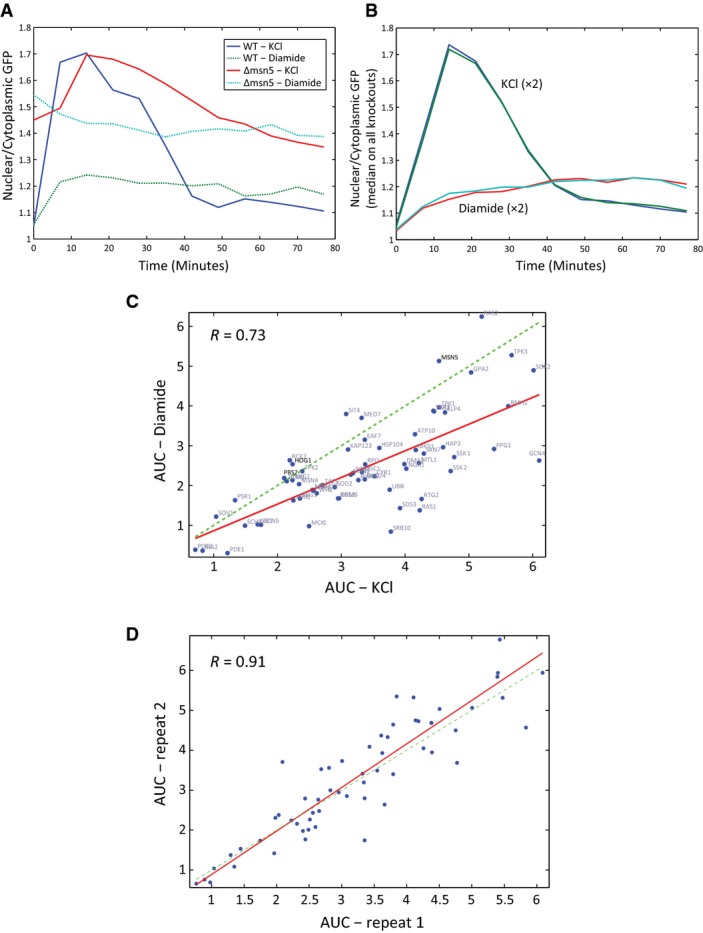
Localization of Msn2-GFP
- The ratio between the nuclear and the cytoplasmic Msn2-GFP over time after the exposure to stress is shown. In the Δmsn5 strain, we observe high nuclear localization of Msn2-GFP at the beginning of the experiment, compared to WT.
- Msn2-GFP nuclear localization shows a stress-specific prototypical profile. The plot compares the dynamics of Msn2-GFP localization in KCl and diamide stress conditions. The average dynamics profile of all the examined strains in two independent repeats is shown.
- Msn2-GFP nuclear localization is correlated between stress conditions. The area under the curve (AUC) of Msn2-GFP localization dynamics was quantified for each mutant and stress condition (Materials and Methods). Scatter plot of the AUC values in KCl and diamide for all strains is shown.
- Two biological repeats of localization experiment lead to similar AUC values. Scatter plot of the AUC estimated for different strains after the exposure to KCl in two independent experiments.