
Figure 2.
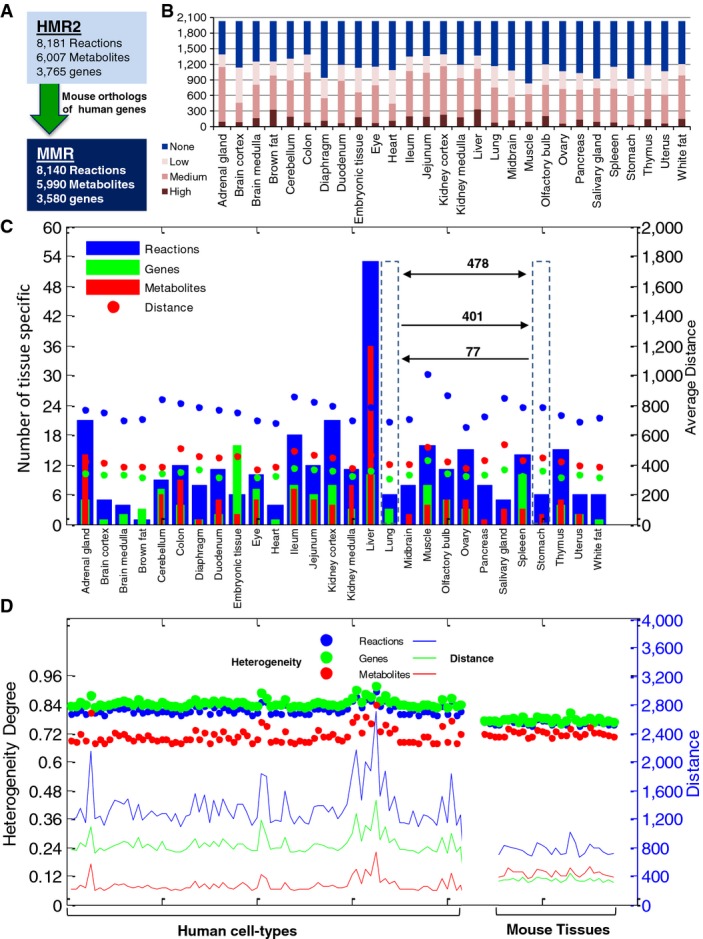
Creation of MMR and generation of tissue-specific GEMs
- Mouse Metabolic Reaction database (MMR) was created using the mouse orthologs of human genes based on Human Metabolic Reaction database 2.0 (HMR2).
- The expression level of the 2,032 proteins used in the generation of the 28 tissue-specific mice models is presented.
- Bar plots represent the distribution of tissue-specific reactions, metabolites, genes, and metabolites across the 28 mouse tissue GEMs. Filled circles depict average distance of each tissue GEMs compared to others. Average distance, calculated based on Hamming distance method, indicates required alteration to transform one tissue model to the other based on the reactions and metabolites and genes. For instance, 478 changes in gene profile are required for intertransformation of GEM for lung and stomach, from which 401 changes in genes correspond to transformation of lung to stomach and 77 changes in genes correspond to transformation of stomach to lung.
- Filled circles represent the heterogeneity degree of 28 mouse tissues and 83 healthy human cell types. Heterogeneity values are projected on the left hand side axis. There is a fall, ˜0.06 degree, in heterogeneity of mice models compared to human modes based on genes and a lower decrease, ˜0.03, based on the reactions. However, comparing mouse tissues to human cells revealed higher heterogeneity based on the metabolites, in contrast to the reaction and genes. Average Hamming distance of GEMs for mouse tissues and human cell types are projected on the right hand axis. Mouse tissues have relatively less, 40–60%, inter-model distance compared to human cells based on the reactions and genes. However, the trend is reversed with around 50% increased inter-model distance for metabolites. In general, mouse tissue-specific GEMs show gain of heterogeneity based on metabolites and loss of heterogeneity based on genes.