
Figure 6.
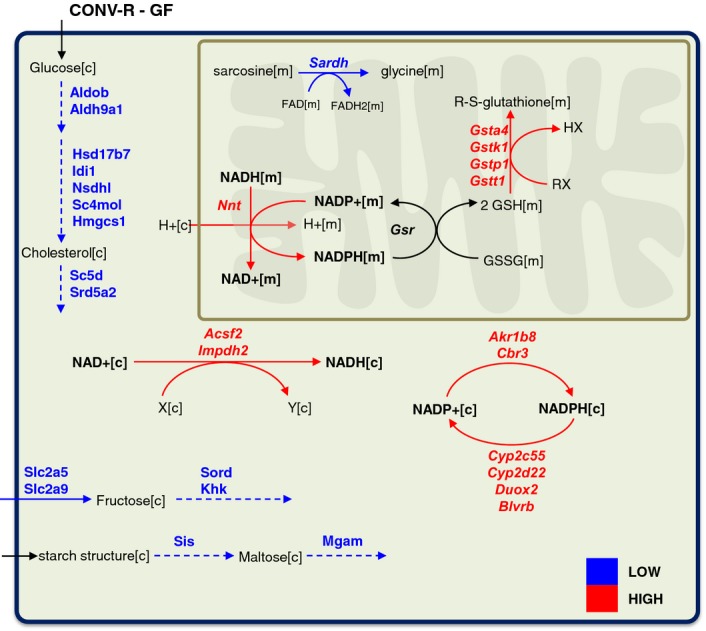
Metabolic differences in the colon tissue
The significantly (Q-value < 0.05) differentially expressed metabolic genes in colon tissue of CONV-R mice compared to GF mice are mapped to the functional GEM for mice colon tissue. Red and blue arrows indicate the significantly (Q-value < 0.05) higher and lower expression of the metabolic genes in CONV-R mice compared to GF mice, respectively.