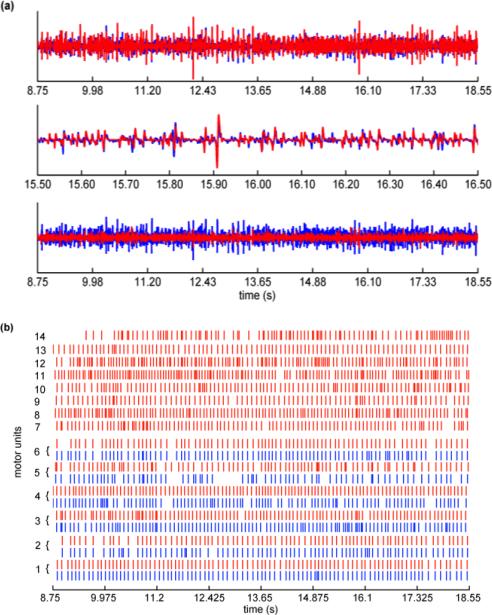
Fig. 3.
(a) The top panel shows the sum of the MUAP trains (red lines) extracted by the KmCKC method compared to the raw surface EMG (blue lines) recordings from FDI muscles (Subject B) in one typical channel, the middle panel shows an expanded segment of the signal, and the bottom panel shows the residual (red lines) after subtraction of extracted MUAP trains from the raw surface EMG compared to the raw surface EMG (blue lines). (b) shows MU firing patterns identified by the KmCKC (red lines) and classic CKC (blue lines) from surface EMG signals of the FDI muscles, the isometric constant force of contraction was held at 10% MVC (Test 3).

