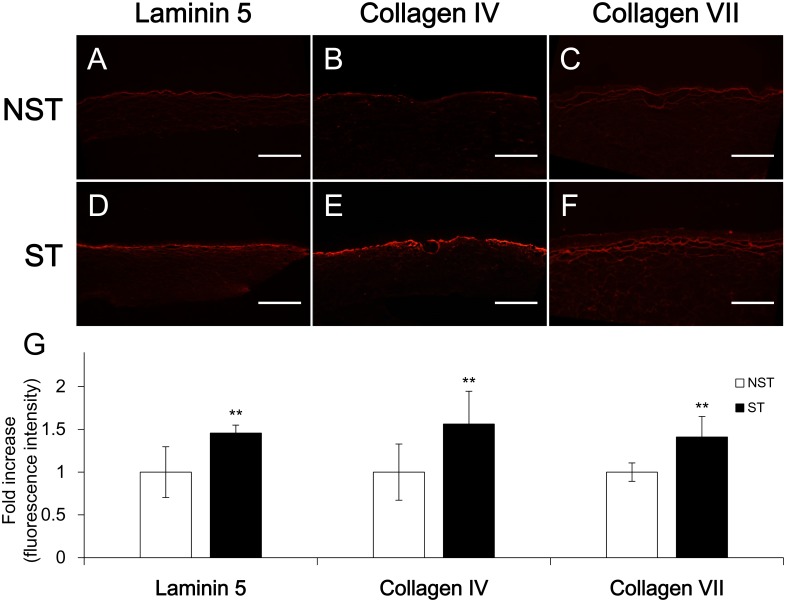
Fig 5. Laminin 5 and collagen IV/VII expression analysis of HSEs by immunofluorescence staining.
(A, B and C) Non-stretch sample. (D, E and F) Stretched sample. Scale bar = 500 μm. (G) Fluorescence intensity of NST group was taken as control and adjusted to the 1 value. Each histogram bar represents the mean value of the normalized and adjusted fluorescence intensity. All three proteins of ST group were significantly greater compared with NST group. **p < 0.01.

