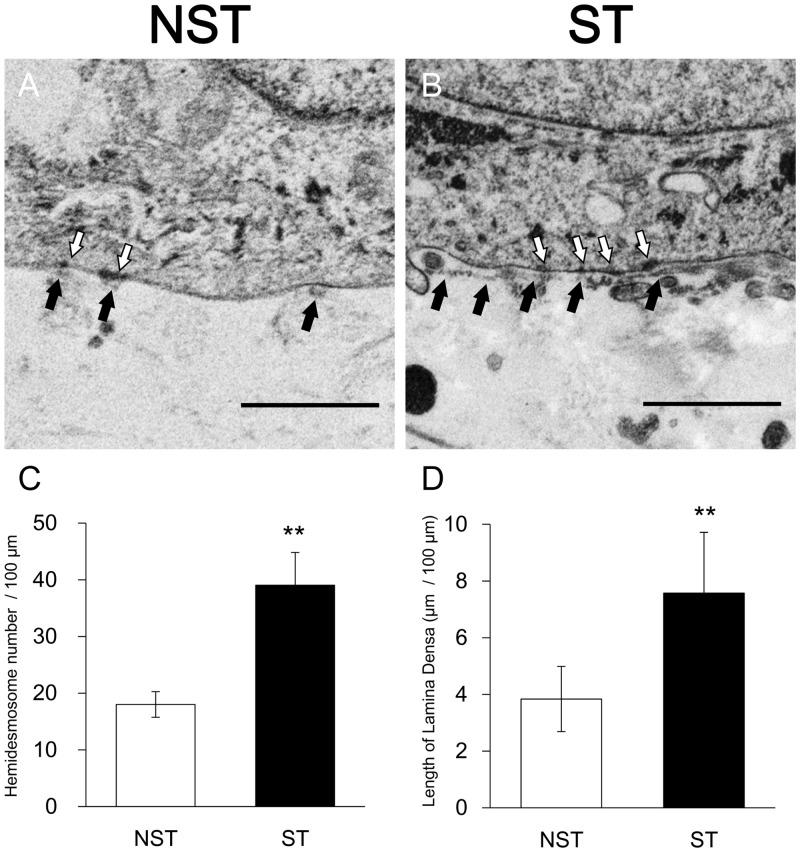
Fig 6. TEM images of HSEs.
(A) Non-stretch sample. (B) Stretched sample. White arrow: hemidesmosome. Black arrow: lamina densa. Scale bar = 1 μm. (C, D) In the ST group, the length of lamina densa and the number of hemidesmosomes per 100 μm of a dermal—epidermal junction were significantly greater than in the NST group. **p < 0.01.

