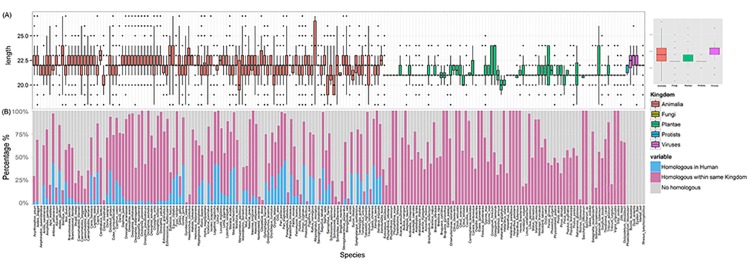
Fig 1. Length distribution of mature miRNA sequences in 5 kingdoms (A) and schematic plot shows statistics of the cross-species sequence comparison (B).

(A) Length distribution of mature miRNA sequences in Animalia (red), Fungi (brown), Plantae (green), Protista (blue) and Viruses (purple) in both histogram (left) and Boxplots (right). (B) Schematic plot shows statistics of the cross-species sequence comparison. Within each species, light blue indicates the percentage of miRNAs that have homologues miRNA in Human, light purple represents the percentage of miRNAs that have homologues in other species within the same kingdom, and gray shows the percentage of miRNAs that have no homologues in any other species.
