
Fig. 1. 2-D PAGE of the periplasmic fraction of A. ferrooxidans grown on thiosulfate.
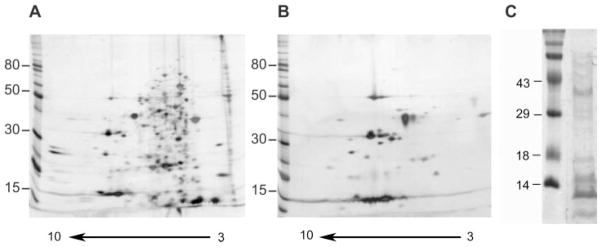
Total proteins (A) or periplasmic fraction (B and C) were separated by 2-D NEPHGE (A and B) with a pH gradient between 3.0 (right side of the gel) and 10.0 (left side of the gel) or by monodimensional SDS-PAGE (C). Spots were detected by silver stain (A and B) or by colloidal Coomassie Blue (C). Molecular mass standards (in kilodaltons) are given on the left of the gels.