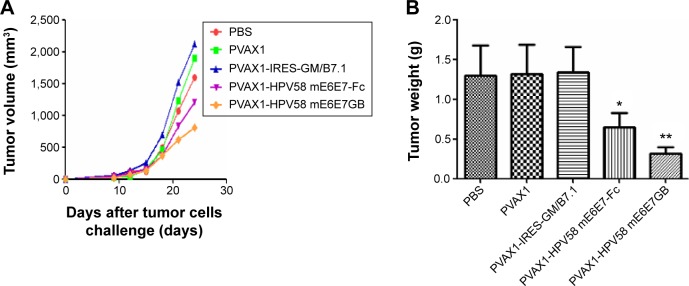
Figure 6.

In vivo tumor growth inhibition experiments to compare the antitumor effects of various DNA plasmids against HPV58 E6E7-expressing B16-HPV58 E6E7 tumors in vaccinated mice.
Notes: The graph shows the tumor growing curve (A) and tumor mean weight (B) on day 24 after B16-HPV58 E6E7 cell challenge. (A) The tumor growing curve of the PVAX1-HPV58 mE6E7FcGB group was the lowest among the mice in the five groups. (B) The tumor weights from tumor-bearing mice after treatment are expressed as mean ± SD. The mean tumors weight in the PVAX1-HPV58 mE6E7FcGB group (0.26±0.11 g) was lower than 1.40±0.52 g for the PBS group, 1.50±0.60 g for the PVAX1 group, 1.62±0.31 g for the PVAX1-IRES-GM/B7.1 group, and 0.66±0.34 g for the PVAX1-HPV58 mE6E7Fc group, and these differences were significant (P<0.01). *P<0.05,**P<0.01.
Abbreviations: PBS, phosphate-buffered saline; SD, standard deviation; HPV, human papillomavirus.
