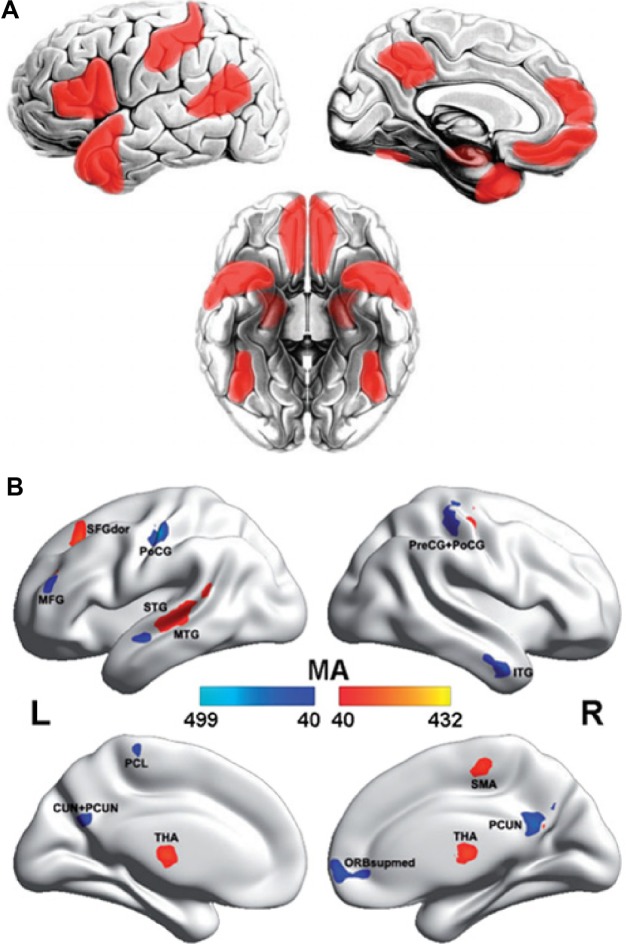
Figure 3.
The brain regions displaying disrupted functional connectivity in autism.
Notes: (A) Areas of the “social brain” that have been found to exhibit decreased functional connectivity in autism. (B) Voxels displaying altered functional connectivity in autism. The color bar represents the degree of connectivity according to the number of significantly affected edges relating to a given voxel. Voxels that displayed weaker functional connectivity in the autistic population than in the controls are shown in blue, and the voxels that displayed stronger functional connectivity in the autistic population are shown in red. Figures are adapted with permission from Brain (http://brain.oxfordjournals.org): Gotts SJ, Simmons WK, Milbury LA, Wallace GL, Cox RW, Martin A. Fractionation of social brain circuits in autism spectrum disorders. Brain. 2012;135(Pt 9):2711–272561 and Cheng W, Rolls ET, Gu H, Zhang J, Feng J. Autism: reduced connectivity between cortical areas involved in face expression, theory of mind, and the sense of self. Brain. 2015;138(Pt 5):1382–1393.63
Abbreviations: L, left; R, right; MA, measure of association; MTG, medial temporal gyrus; STG, superior temporal gyrus; ITC, inferior temporal gyrus; MFG, middle frontal gyrus; ORBsupmed, ventromedial prefrontal cortex; PCUN, precuneus; CUN, cuneus; PCL, paracentral lobule; PoCG, postcentral gyri; PreCG, precentral gyri; THA, thalamus; SFGdors, superior frontal gyrus, dorsal part.

