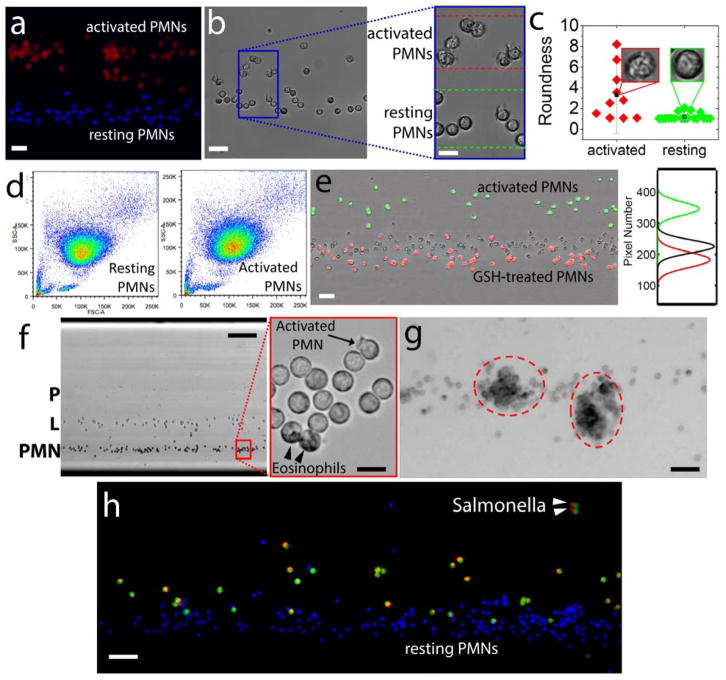
Figure 3. Static levitation of functionally-altered blood cells.
(a–c) Changes in PMN density associated with PMA activation. (a) Low magnification, fluorescence image of magnetically focused PMNs treated with 10 nM PMA (activated PMNs, red) or buffer (resting PMNs, blue). Scale bar is 40 μm. (b) Low magnification, brightfield image of the levitating PMN. Scale bar is 40 μm. Inset, showing the shape and optical density differences between resting and activated PMNs. Scale bar is 20 μm. (c) Roundness differences between normal and activated PMNs. (d) Flow cytometry results for normal PMN (left) and activated PMN with PMA (right). (e) Scavenging intracellular ROS alters PMN confinement height. Activated PMNs (green), resting PMNs (unstained), and GSH-treated PMNs (red). Scale bar is 40 μm. (f) Magnetically-driven density separation of blood cells. Left panel, low magnification (4×) of buffy coat cell levitated in 30 mM Gd+ solution for 15 minutes, showing PMNs (PMN), lymphocytes (L) and platelets (P). Scale bar is 200 μm. Right panel, high magnification (40×) of resting PMNs, showing an activated PMNs with rough partial outline (arrow) and two eosinophils showing darker granules in the cytoplasm (arrowheads). Scale bar is 20 μm. (g) Low magnification (10×), two hours after levitation, PMNs underwent self-activation followed by homo-typical aggregation (red dotted circles). Scale bar is 80 μm. (h) Phagocytosis of salmonella by human PMNs. Resting PMNs (blue) and PMNs (green) pre-incubated with Alexa-594-labeled Salmonella were mixed, resuspended in 30 mM Gd+ 200 μL, and magnetically confined for 20 minutes. Arrowheads point to ingested Salmonella. Scale bar is 100 μm.

