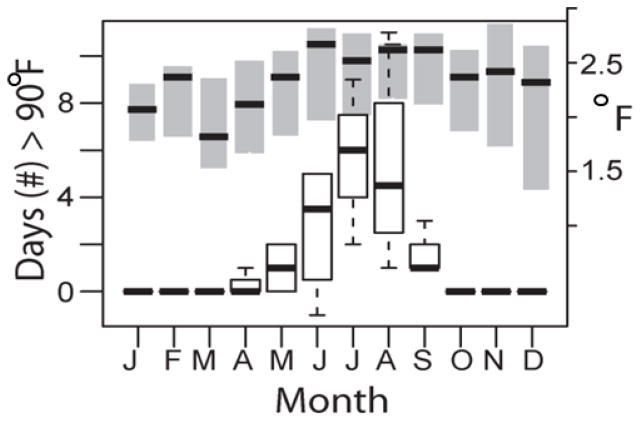
Figure 1. An urban heat island.
Differences in climate metrics for 2011–2013 between urban and suburban sites in Baltimore, Maryland. Boxplots show the additional number of days with maximum daily temperature ≥ 90°F (left axis) at the urban versus suburban site. Right axis shows increase in mean monthly temperature at the urban site (shaded bars). Standard boxplot designations used; dark band denotes median values. Data from CDC.NOAA.gov, collected from NOAA stations located at Baltimore-Washington International Airport and Maryland Science Center.

