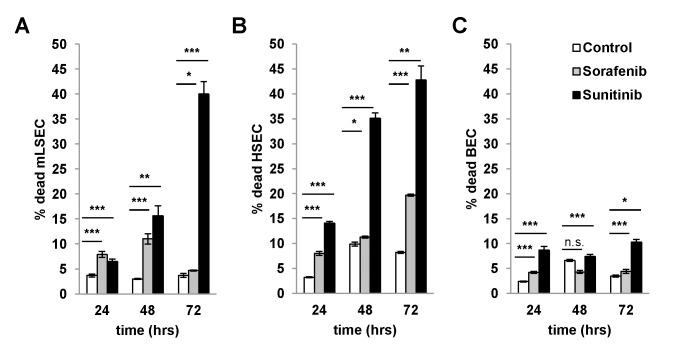
Fig 5. Cytotoxicity and cytostatic effects of angiogenic inhibitors.
(A-C) Cell cycle analysis by flow cytometry with DAPI staining after treatment of mLSECs, HSECs and BECs with corresponding IC50 values for the times indicated. mLSEC: IC50 sorafenib 7.3 μM, sunitinib 8.0 μM; hHSEC: IC50 sorafenib 2.88 μM, sunitinib 5.67 μM; BEC: IC50 sorafenib 4.33 μM, sunitinib 8.28 μM. *p<0.05, **p<0.01 or ***p<0.005.

