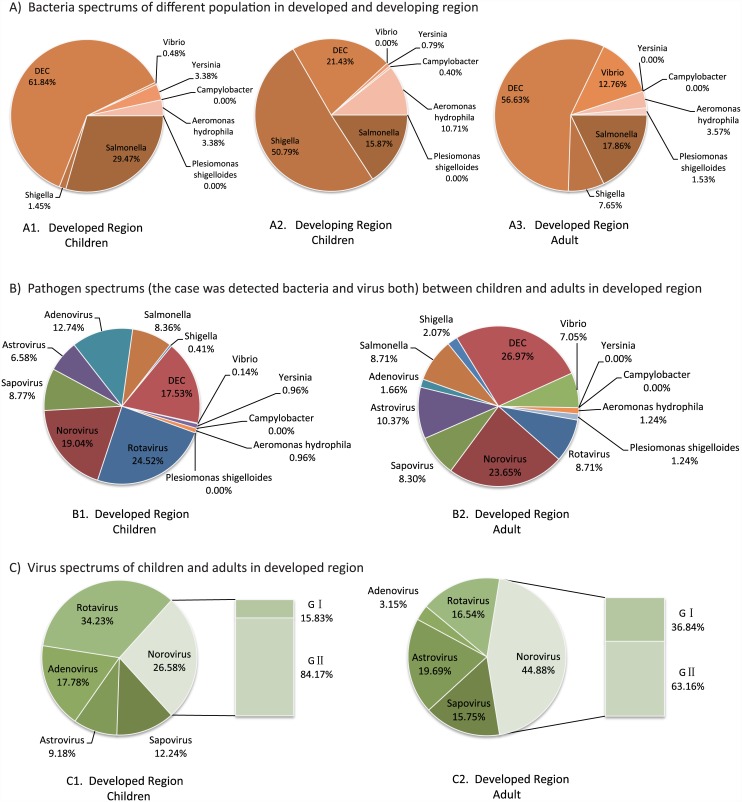
Fig 2. Pathogen Spectrum of cases in the developed and developing region (%: proportion).
A1. Bacteria spectrum of childhood cases in the developed region; A2: Bacteria spectrum of childhood cases in the developing region; A3: Bacteria spectrum of adult cases in the developed region; B1. Pathogens (one case was detected bacteria and virus both) spectrum of childhood cases in the developed region; B2: Pathogens (one case was detected bacteria and virus both) spectrum of adult cases in the developed region. C1. Virus spectrum of childhood cases in the developed region; C2: Virus spectrum of adult cases in the developed region.

