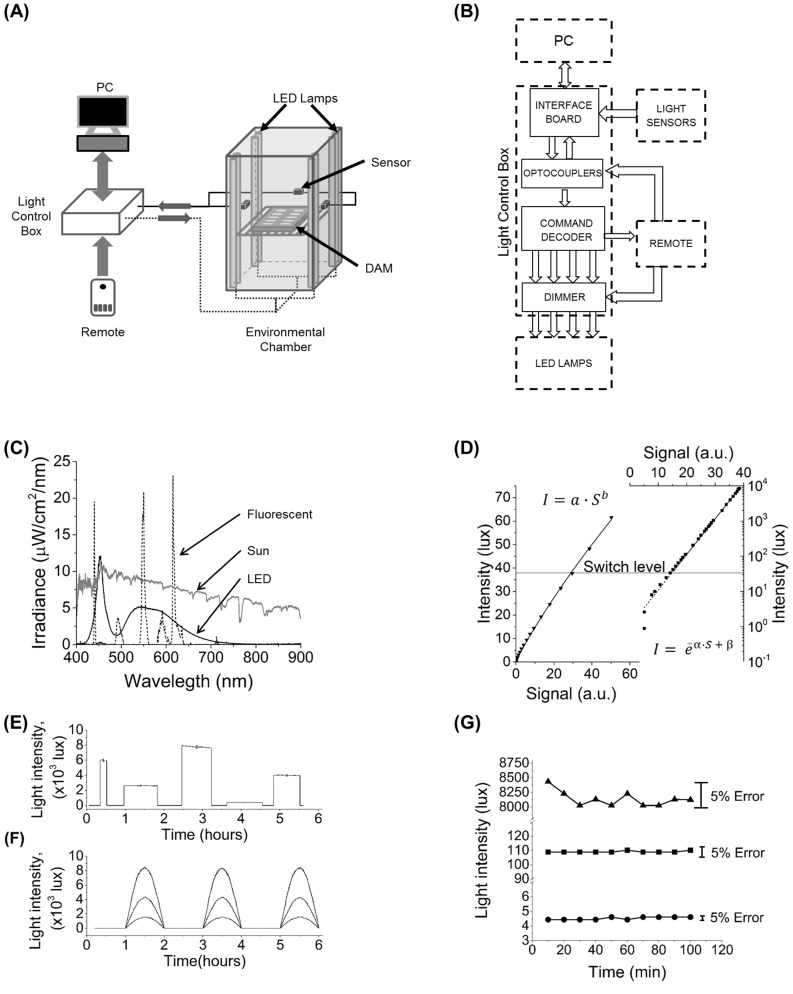
Fig 1. Illumination system and its characteristic.
(A) Schematic of the experimental setup and the production and detection of light. Each of the eight LED lamps are controlled from a computer to provide illumination between 0 and 8800 lux. The level of illumination is reported to a computer by three pairs of photodiode-based sensors. (B) Information flow between main components of light control box and peripheral devices. Interface board receives control signals from computer and forwards them to the command decoder which interprets the signal to set the desired light intensity. (C) Typical irradiance spectra for the installed LED lamp (solid line) compared to the previous fluorescent lamp (dashed line) and local (25° 43' 24.26'' N, 80° 16' 45.89'' W) sunlight (grey line, not to scale). LED lamp spectrum is broadly distributed, while fluorescent irradiance is concentrated in three narrow peaks. The LED peak at 450 nm coincides with one of the peaks in the action spectrum of Drosophila CRYPTOCHROME. Compared to fluorescent lamps, the LED spectrum better approximates light conditions in the natural environment. (D) Calibration data for a low range (left) and a high range (right) sensor. Data shown in symbols and fits in solid lines. The low range sensor has a linear response while the high range sensor has a logarithmic response. For the sensor shown parameters were a = 0.29,b = 0.86,α = 2.33x10⁻², β = 6.71x10⁻². Software controlling the light system automatically switches from low to high range sensor at 38 lux (horizontal line). (E) Square patterns of different LED intensities and durations. Error bars at peak values represent 5% variation with respect to each target value. (F) Half-sine light cycles of different maximum intensities. The half-sine shape with a period of 24 hours closely simulates variations in daily sunlight intensity. (G) Stability of the system for three different LED intensities each maintained for 100 minutes. For all tests, intensity variations were limited to 5% error bounds.

