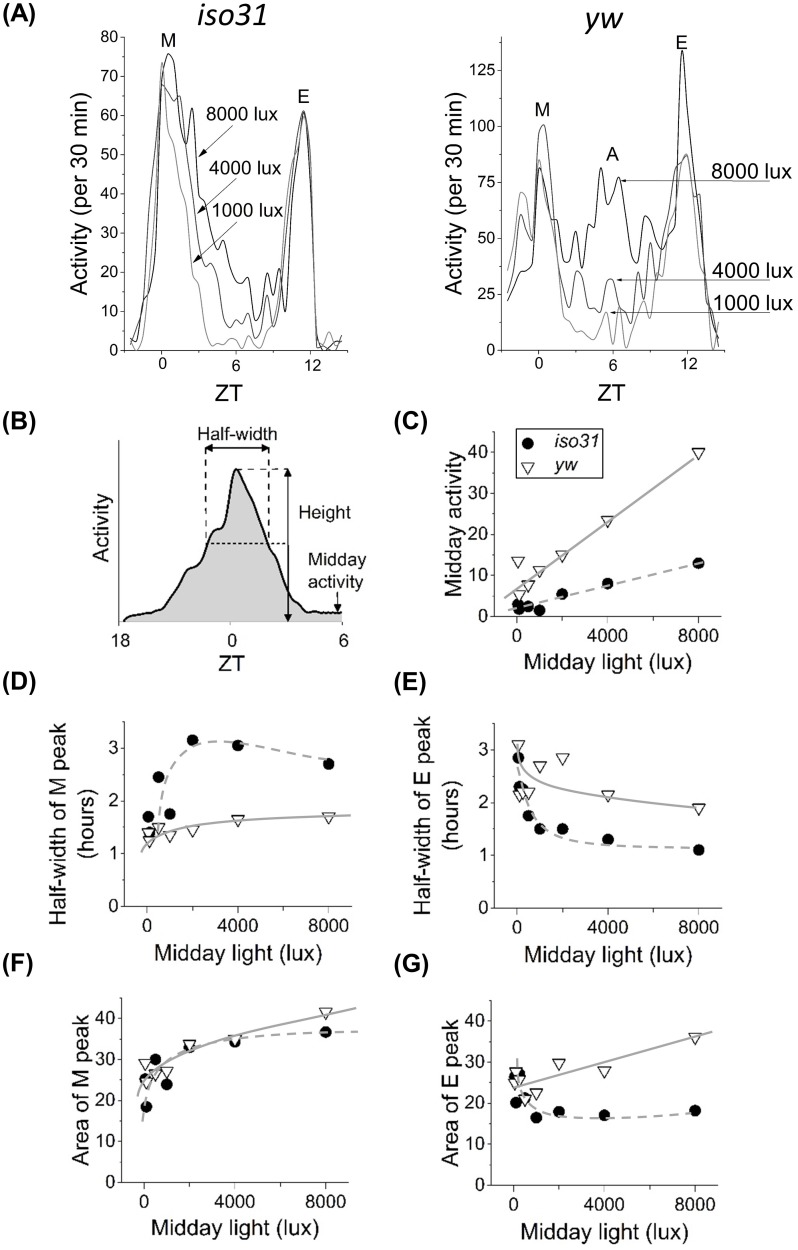
Fig 2. Locomotor activity at different light intensities.
Population-averaged activity profiles of iso31 (panel A, left) and yw (panel A, right) for different midday light levels. Only yw shows appearance of the A-peak for ~8000 lux. (B) Cartoon of the peak properties plotted in C-G. iso31 flies shown in black circles and yw flies in white triangles, grey solid and dashed curves are guides to the eye. The midday activity (C) is an average activity of 4 hours from 4 to 8 hours after lights-on. It increases with light intensity for both fly strains. (D) Half-width of the M peak increases while (E) half-width of the E peak decreases with light intensity. Areas of M and E peaks (F and G) represent total activity from 3 hours before to 3 hours after respective peak. With the exception of the E-peak of iso31, areas under the peaks increase with increase in light intensity. Legend in (C) applies to panels C-G.

