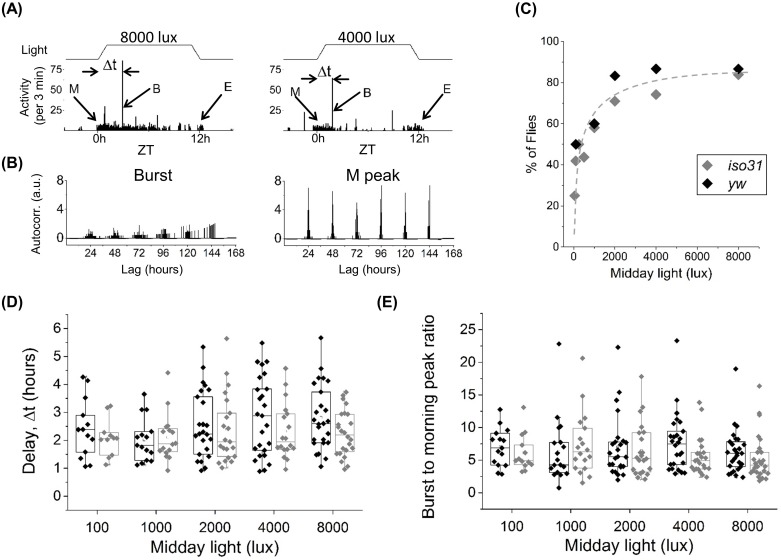
Fig 3. Individual flies show significant burst of activity after start of morning activity.
(A) Examples of activity (3 minutes bins) for two different flies with midday light intensity of 8000 (left) and 4000 (right) lux. Morning/evening peaks denoted as “M” and “E” respectively, burst of activity as “B”, delay of B peak after lights turns on as Δt (activity in black columns and light patterns in black line on top). (B) Normalized autocorrelation functions for the stochastic burst (left) and the periodic M peak (right) for a fly measured in LD for 6 days. (C) Number of flies (in percent of total number), that showed the burst at different midday light intensities. Percentage of flies showing burst increases monotonically with light intensity. Grey dashed curve is a guide to the eye and not a fit to the data. (D) Onset of the burst after lights-on for iso31 and yw for different midday light intensities. Δt≈110−150 minutes on average, independent of light intensity and genetic background. (E) Ratio of the burst activity to the average morning activity for iso31 and yw at different midday light levels. Average value of the ratio ~5 for iso31 and ~6 for yw. Legend and number of flies, iso31 (N = 32) and yw (N = 32), in (C) applies to panels C-E.

