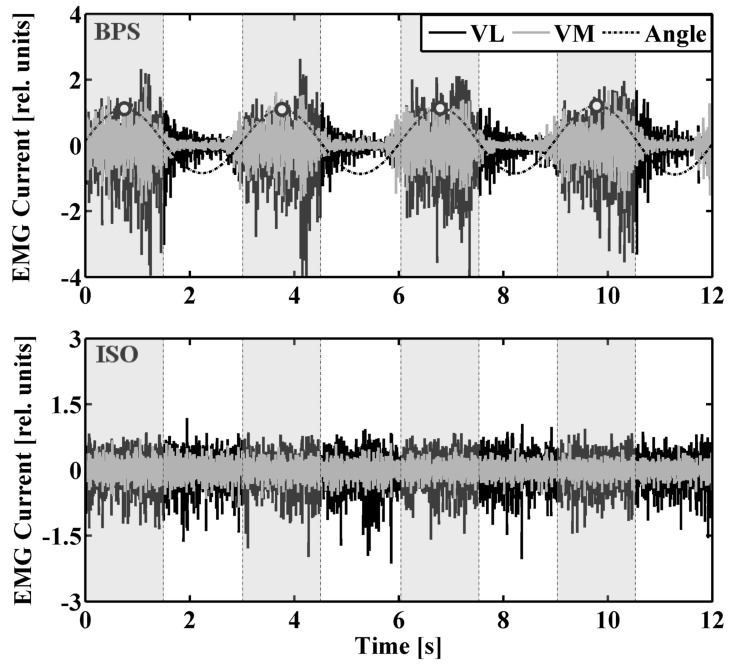
Fig 3. Procedure to separate individual data sequences according to peaks in knee flexion angle.
Example for a bipedal squat (top panel) and corresponding isometric squat (bottom panel). Dashed vertical lines to the left and right of peaks in the knee flexion angle trace indicate the boundaries of individual data sequences (shaded) that were used for further analysis.

