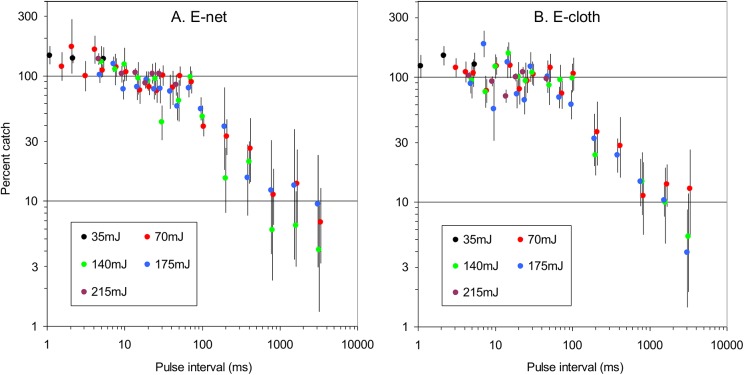
Fig 4. Effect of pulse interval on catches of tsetse from grids.
A: E.net grid beside cloth. B: E-cloth. Catches at each interval tested are expressed as a percent of simultaneous catches from a control grid operating at a pulse interval of 15ms. Separate comparisons are made at various energy levels (mJ) per pulse, and the results are plotted separately. The test and the control treatments involved in any one plot had the same energy per pulse. Vertical bars through plots indicate the 95% confidence limits of the mean percent. Plots are often displaced a little horizontally to ensure that the confidence limits of the each plot can be distinguished.

