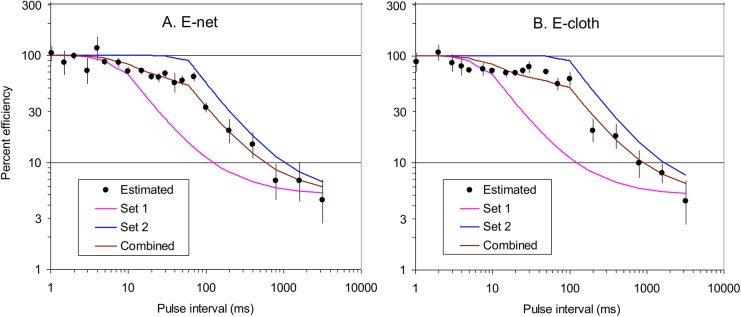
Fig 5. Fitting curves to the estimated absolute efficiency of electrocution of tsetse contacting grids operated at various pulse intervals.

A: E.net grid beside cloth. B: E-cloth. The plots of percent absolute efficiency derive from pooling and adjusting the data for relative catches at various energies per pulse in Fig 4, as detailed in the text. Vertical bars through the plots indicate the 95% confidence limits. The curves labelled Set 1 and Set 2 refer to those modelled with the various sets of parameter values indicated in the text. The curve labelled Combined is the average of the Set 1 and Set 2 curves.
