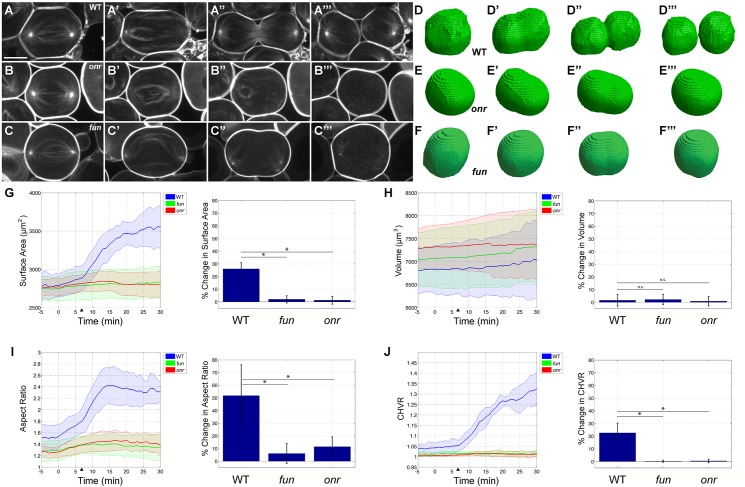
Fig 4. Failure in anaphase elongation, cleavage furrow progression, and surface area addition in onr and fun mutant cells.
(A-C) Still frames from time-lapse confocal microscopy of wild-type (A), onr z4840mutant (B), and fun z1010 mutant (C) male germline cells expressing PLCδd-PH-GFP and β-Tub-GFP (imaged simultaneously in single channel). Cells are shown just prior to elongation (A, B, C), immediately before ingression (A’, B’, C’), during ingression (A”, B”, C”), and after successfully completing or failing to complete cytokinesis (A”‘, B”‘, C”‘). (D-F) Representative segmented and voxelized cells of wild-type (D), onr z4840 mutant (E), and fun z1010 mutant (F) cells. (G-J) Quantitative computational analysis of surface area (G), volume (H), aspect ratio (I), and convex hull volume ratio (a measurement of furrow ingression, J) in wild-type (blue), onr z4840 mutant (red), and fun z1010 mutant (green) cells. Left, lines are average values of wild-type (n = 8), onr (n = 11), and fun (n = 10) segmented cells. Data from individual cells were aligned such that t = 0 is the start of anaphase elongation, while arrowheads mark the initiation of cytokinesis in wild-type cells (see Materials and Methods). Right, quantitation of percent change from t = 0 to t = 25 min. Increases in surface area, aspect ratio, and CHVR observed in wild-type cells are disrupted in onr z4840 and fun z1010 mutant cells, while no significant difference is observed in volume. Prior to the start of anaphase elongation, cell volume and surface area were nearly identical in wild type, onr mutant, and fun mutant cells (p-values ranging from 0.0838 to 0.5969). All movies start during early anaphase and end after successful (wild-type) or failed (fun and onr) cytokinesis. Shaded region indicates standard error (G-J); *p<0.0001, significantly different from control in the two-sample Student t-test; n.s. = not significant, p>0.23. Scale bar, 10 μm.

