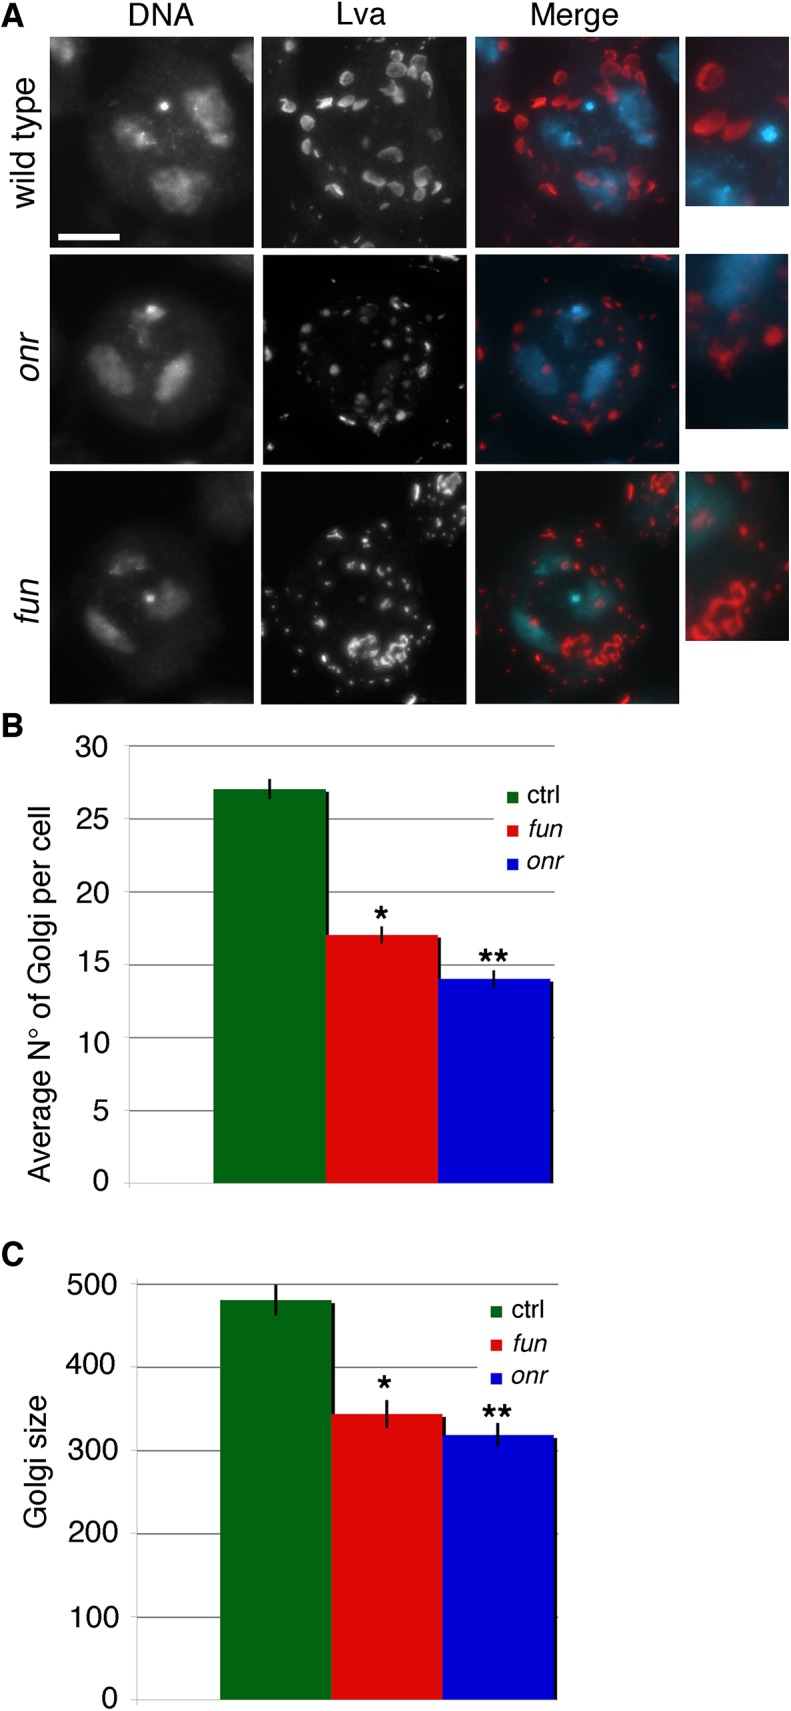
Fig 5. Defects in Golgi structure in fun and onr mutant cells.

(A) G2 primary spermatocytes from wild-type, onr z4840 /Df(3R)Espl3 and fun z1010/Df(3R)Exel6145 mutant males, stained for the Golgin Lva (red) and DNA (blue). Enlargements of Golgi stacks are shown on the right of each panel. Scale bar, 10 μm. (B) Average number of Golgi bodies per cell (± SEM) visualized in G2 spermatocytes from wild type (n = 50), onr z4840 /Df(3R)Espl3 (onr, n = 48), or fun z1010/Df(3R)Exel614 (fun, N = 48) after staining for Lva. Numbers of Golgi per cell in fun and onr mutants are significantly different from wild type in the Student t test:*p<0.0001, **p<0.0001. (C) Average area (± SEM) of Golgi bodies, quantified by ImageJ (expressed in arbitrary units), in G2 primary spermatocytes stained for Lva, Golgi sizes are significantly different in fun z1010/Df(3R)Exel614 (fun) and onr z4840 /Df(3R)Espl3 (onr) compared to wild type using the Student t test, *p<0.0001, **p<0.0001.
