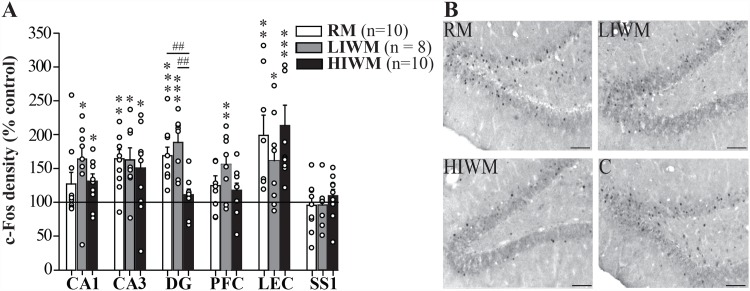
Fig 3. The expression of c-Fos is decreased in the dentate gyrus of HIWM trained rats as compared to RM or LIWM rats.
(A) Density of c-Fos positive cells in the three experimental groups relative to paired controls (black line) in the CA1, CA3 and DG of the hippocampus, medial prefrontal cortex (PFC), lateral entorhinal cortex (LEC) and primary somatosensory cortex (SS1), after 10 days of training. No increase in c-Fos expression was observed in the DG of HIWM rats (HIWM versus C: Mann–Whitney U-test, p = 0.3181, RM versus C: *** p = 0.0003, *** LIWM versus C: p = 0.0005, HIWM versus LIWM: ## p = 0.001, RM versus HIWM: ## p = 0.0012). * p < 0.05; **, ## p < 0.01; *** p < 0.001. Dots represent each animal in each group. (B) Representative photomicrographs showing c-Fos-stained nuclei in the dorsal DG. Scale bar, 100 μm.

