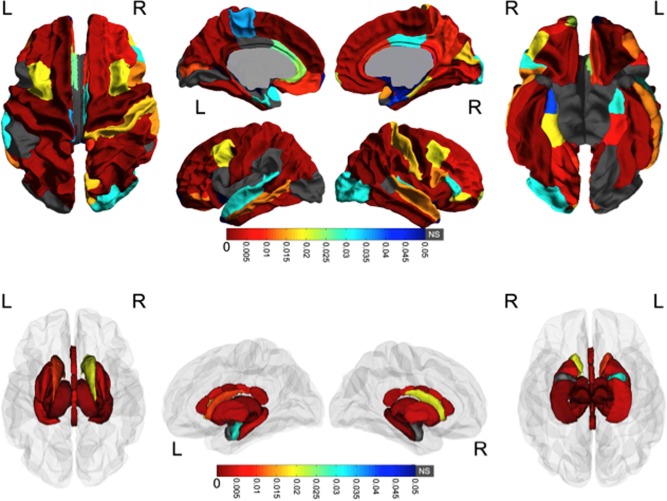
Figure 1.

Group differences in volume. White matter and subcortical gray matter regions with significant volume differences between groups are colored according to their FDR‐corrected significance values. Gray indicates no significant group differences. Note the widespread volume differences; in all cases subjects with PAE had smaller volumes than control subjects. [Color figure can be viewed in the online issue, which is available at http://wileyonlinelibrary.com.]
