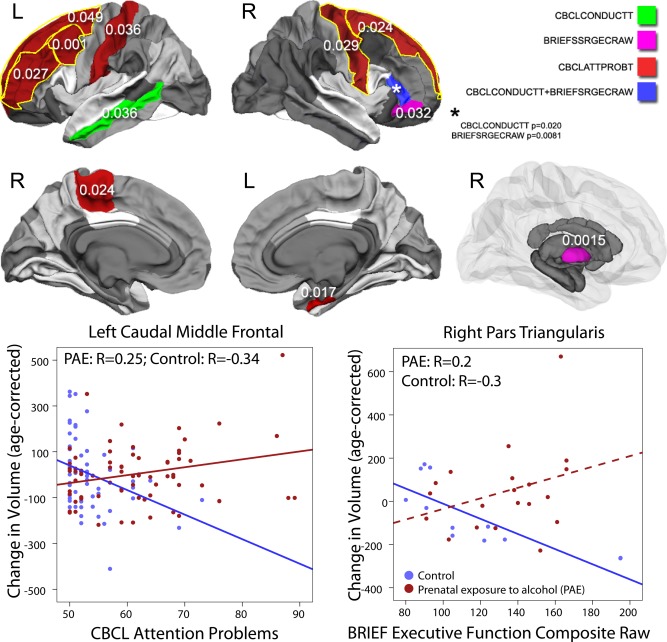
Figure 4.

Significant group‐score interactions are shown for white matter and subcortical gray matter volumes. In several brain regions, baseline cognitive and/or behavioral scores were predictive of volume changes over time, and these relationships were different in subjects with PAE than control subjects (interactions all P<0.05). For behavioral scores in most cases, PAE subjects with worse behavioral problems demonstrated larger volume increases over time, while relationships in control subjects were opposite (worse behavior problems associated with smaller volume increases) or nonsignificant. Scatter plots are shown for select regions as examples; dotted lines indicate relationships which were not significant within that group. [Color figure can be viewed in the online issue, which is available at http://wileyonlinelibrary.com.]
