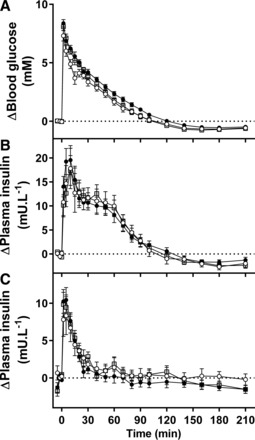
Fig. 4.

Blood glucose (A) and plasma insulin (B) during an intravenous glucose tolerance test and plasma insulin (C) during an arginine test in CON (○), PR (●), and PR + EX-4 (gray square) offspring. Data are estimated means ± SE and are shown as change from fasting (pretest) concentrations.
