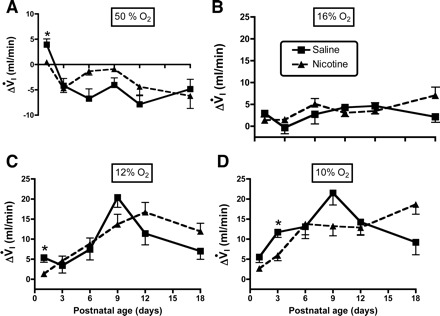
Fig. 3.

A–D: influence of age and PNE on the ventilatory response to changing inspired oxygen levels: 50, 16, 12, and 10% O2, respectively. Each panel shows the change in V̇i (ΔVi) on the y-axis, and postnatal age on the x-axis. The results of statistical analyses are given in Table 1 and in the text of results. Differences between treatment groups were few and, when present, small. *Difference between groups at the indicated postnatal age, P < 0.05.
