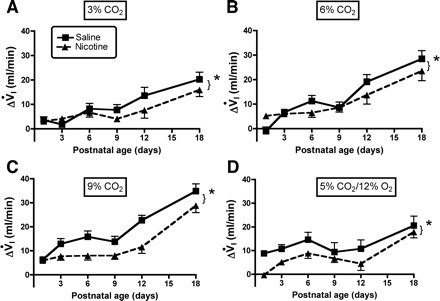
Fig. 6.

A–C: influence of age and PNE on the ventilatory response to different levels of hyperoxic hypercapnia are shown: 3, 6, and 9% CO2, respectively. The results of statistical analyses are given in Table 2 and in the text of results. As above, each panel shows the ΔVi on the y-axis, and postnatal age on the x-axis. *Significant treatment effect at each level of hypercapnia; however, there was not a significant age-treatment interaction at any level of hypercapnia, indicating that the effects were proportional across the age range studied (refer to Table 2). D: the ΔVi in response to combined hypercapnia/hypoxia; as with hyperoxic hypercapnia, the response was blunted in PNE animals (refer to Table 3 and results).
