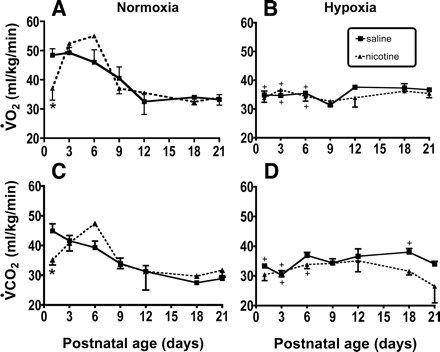
Fig. 9.

Changes in mass-specific O2 consumption (V̇o2) and CO2 production (V̇co2) in normoxia and hypoxia (10% O2/90% N2). A and B: developmental changes in V̇o2 under normoxic and hypoxic conditions, respectively. C and D: the developmental change in V̇co2 in normoxia and hypoxia, respectively. Experiments were done in up to 12 control and 12 nicotine-exposed pups, with each neonate studied on each of the indicated postnatal days, as described in methods. +Hypoxia significantly different than normoxia within a treatment group; *saline different than PNE at indicated postnatal age: P < 0.05.
