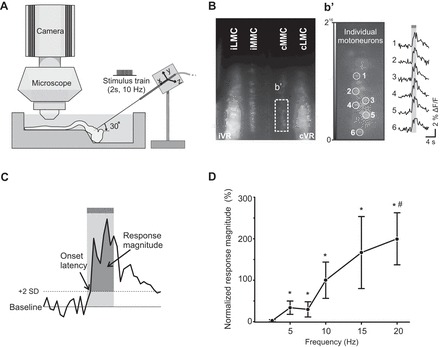
Fig. 1.

Imaging pontine reticular formation (PRF)-evoked calcium responses in spinal motoneurons (MNs) of the isolated brain stem-spinal cord mouse preparation and effective PRF stimulation parameters. A: diagram of experimental setup. Spinal MNs in the medial and lateral motor columns (MMC and LMC) of C6, T7, and/or L2 segments are labeled with the fluorescent calcium indicator CGDA in an isolated brain stem-spinal cord neonatal mouse preparation. After labeling, the preparation is transferred to a recording chamber with circulating oxygenated artificial cerebrospinal fluid, and a tungsten microelectrode is inserted in the PRF to activate pontine reticulospinal (pRS) neurons electrically. Changes in MN fluorescence before, during, and after PRF stimulation are visualized with a ×40 water-immersion objective and recorded with a charge-coupled device (CCD) camera. B: low-magnification image of calcium fluorescence in MMC and LMC MNs in the L2 segment a few hours after applying CGDA to the ipsilateral (i) and contralateral (c) ventral roots (VRs). Laterality is expressed relative to the side of the stimulation in the pons. b′, Left: high-magnification image (16-bit) of a single frame (1 out of 480 frames) showing baseline fluorescence intensity in a subset of cMMC MNs. Right: changes in fluorescence (F) during PRF stimulation (2-s train, 10 Hz, 100 μA or stimulus intensity of 2 T) during 50 consecutive frames shown as waveforms for 6 cMMC MNs (labeled 1–6). C: measurement method: a PRF-evoked response in individual MNs was defined as a positive waveform deflection that remained above the detection limit (mean prestimulation baseline + 2 SD) throughout the entire duration of the stimulation train. The area between the positive waveform deflection and the detection limit (darker shaded area) was defined as the response magnitude. D: graph displaying the magnitude-frequency curve for PRF-evoked responses in LMC MNs of the L2 segment when stimulating with 2-s trains at 2 T and 2.5 Hz (n = 8), 5 Hz (n = 8), 7.5 Hz (n = 7), 10 Hz (n = 8), 15 Hz (n = 6), and 20 Hz (n = 7). Each point represents a grand average (average across several preparations) with ±1 SE expressed as a percentage of the grand average response at 10 Hz. Asterisks and hash symbol indicate statistically significant difference (P < 0.05) from responses obtained at 2.5 and 5 Hz, respectively.
