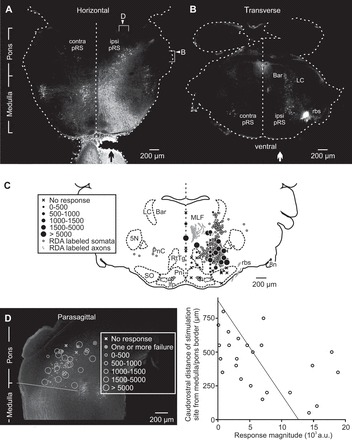
Fig. 3.

Spatial distributions of pRS neurons and effective stimulation sites overlap. A: horizontal section (50 μm) showing the spatial distribution of reticulospinal neurons retrogradely labeled by application of tetramethylrhodamine-conjugated dextran amine (RDA) to the right VF at C2 level (vertical black arrow). Reticulospinal neurons were found bilaterally both in the medulla and the pons, but the contralateral population was sparser in the pons. Right arrowhead: approximate level of the section shown in B. Right bracket: approximate range covered by the 5 consecutive sections used in C. Top arrowhead: approximate level of the section shown in D. Top bracket: approximate range covered by the 4 consecutive sections from which stimulation sites were gathered and shown in D. B: the relatively restricted and predominantly ipsilateral spatial distribution of RDA-labeled pRS neurons shown in a single 50-μm transverse section taken in the middle of the pons. On the side of the RDA application (vertical white arrow), a dorsal population of locus coeruleus (LC) and Barrington's nucleus (Bar) neurons and a ventrolateral bundle of rubrospinal axons are also labeled. C: locations of RDA-labeled pRS neurons (solid closed gray circles) and stimulation sites in 5 consecutive 50-μm transverse sections encompassed by the right bracket in A plotted on a reference section from a postnatal day 3 mouse. Stimulation sites are represented by either an X or a black circle depending on whether they evoked calcium responses in L2 MNs. The size of the black circle is proportional to response magnitude (relative units, as shown in the inset). D, left: the distribution of RDA-labeled ipsilateral pRS neurons together with the locations of stimulation sites from 4 experiments shown in a 50-μm parasagittal section. Only stimulation sites at a distance of ≤100 μm from the labeled neurons are included. The oblique solid line indicates the border between medulla and pons as used in this study. Right: graph displaying the caudorostral position of 24 stimulation sites vs. the largest response magnitude they evoked in L2 MNs. The coefficient of determination of the regression line r2 = 0.25. 5N, trigeminal motor nucleus; 8n, vestibulocochlear nerve; ipsi pRS and contra pRS, ipsilateral and contralateral pRS populations; lfp, longitudinal fasciculus of the pons; MLF, medial longitudinal fasciculus; Pn, pontine nuclei; PnC, nucleus reticularis pontis caudalis; RtTg, reticulotegmental nucleus of the pons; rbs, rubrospinal tract; SO, superior olive; a.u., arbitrary units.
