Fig. 5.

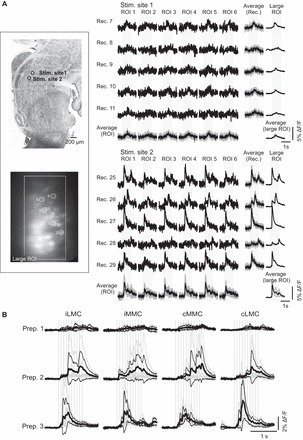
Diversity of responses elicited by different stimulation sites and similarity of responses within and between motor columns. A: example of an experiment in which responses evoked in 6 different iLMC MNs (ROI 1–6) from 2 stimulation sites are compared. Left: the location of the 2 stimulation sites is shown on a parasagittal reference section (top) and the location of the recorded L2 MNs on a background-subtracted, z-stacked image (bottom). Right: for each stimulation site, 5 recordings are shown (Rec. 7–11 and 25–29). Within each recording, the responses in the different MNs are very similar. Occasionally, the response pattern varied from 1 recording to another (for example, from Rec. 26 to 28). Even in these instances, however, the responses in the different MNs remain similar. The 2 separate sets of average responses shown at the bottom [Average (ROI)] and on the right-hand side [Average (Rec.)] show the variability across recordings for each MN and across MNs within each recording session, respectively. Average responses are shown as black waveforms, and the gray waveforms represent 1 SD above and 1 SD below these average responses. Responses across MNs within a given recording session tended to show less variability (smaller SDs). For comparison, the population response (large ROI) during each recording and the average across all recordings are also shown. B: averaged population responses (large ROIs) from a single stimulation site showing similarity of responses in iLMC, iMMC, cMMC, and cLMC in 3 different preparations. Each average was obtained from 4 to 10 individual recordings. See legend for Fig. 4A for other details.
