
Fig. 3.
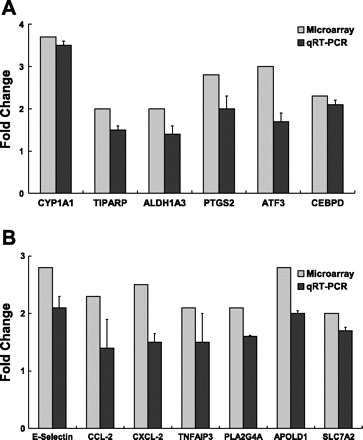
Confirmation of expression of selected genes in HAEC exposed to sum06 APM by quantitative real-time RT-PCR. A: induction of CYP1A1, TIPARP, ALDH1A3, PTGS2, ATF3, and CEBPD gene expression. B: induction of E-selectin, CCL-2, CXCL-2, TNFARP, PLA2G4A, APOLD1, and SLC7A2 gene expression in HAEC exposed to sum06 APM exposure compared with control H2O-treated group. Microarray analysis: pooled n = 3 per GeneChip. Real-time quantitative RT-PCR: n = 3, P ≤ 0.05.