Figure 1.
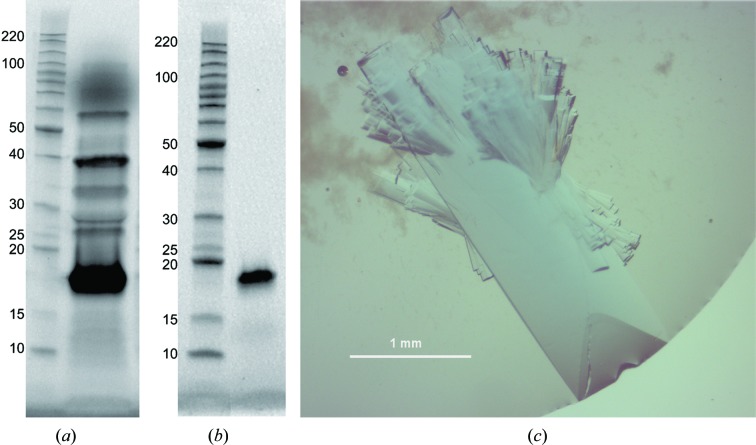
SDS–PAGE analysis of JdLPMO10A production and the resulting crystals. In (a) lane 1 contains Benchmarker protein ladder (Life Technologies) with molecular weights labelled in kDa. Lane 2 contains the E. coli periplasmic extract containing overexpressed JdLPMO10A (15.5 kDa). In (b), lane 1 contains protein ladder and lane 2 contains JdLPMO10A purified by anion-exchange and size-exclusion chromatography used for protein crystallization. (c) A typical crystal grown for neutron diffraction studies of JdLPMO10A. Smaller crystals attached to the large crystal were either removed with a loop or were displaced during the process of mounting. The remaining satellite crystals did not affect the diffraction of the major crystal.

