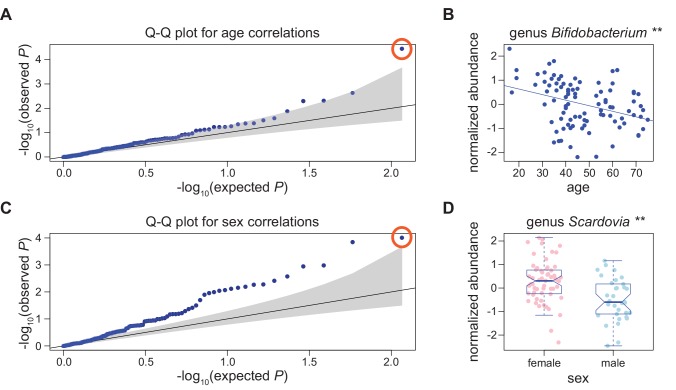
Fig 1. Bacterial abundance correlations with age and sex.
A) Q-Q plot for correlations of 116 common bacterial taxa with age in samples collected in winter. Gray shading represents the 95% confidence interval of the null. The point circled in orange is genus Bifidobacterium. B) Abundance of genus Bifidobacterium is inversely correlated with age in samples collected during the winter (** q ≤ 0.01). C) Q-Q plot for correlations of 116 common bacterial taxa with sex in samples collected in winter. The point circled in orange represents genus Scardovia. D) Genus Scardovia was significantly more abundant in females (n = 60) than in males (n = 33) in winter (** q ≤ 0.01).

