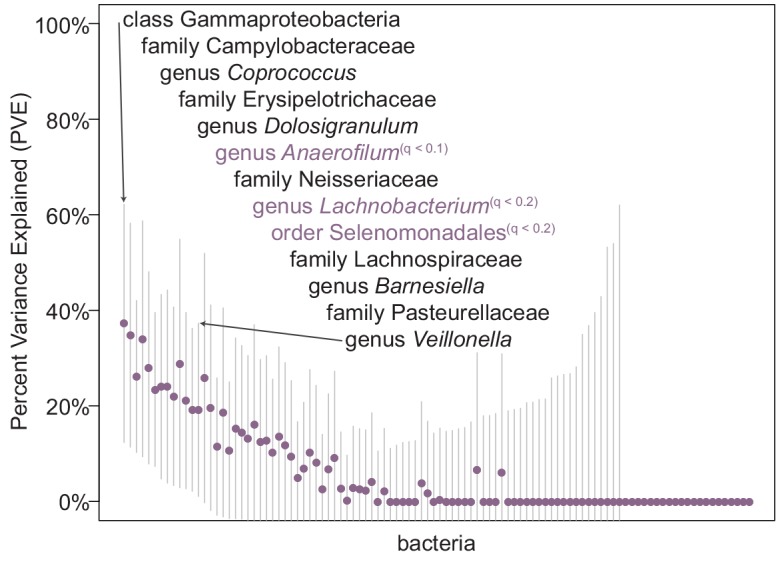
Fig 2. “Chip heritability” for 102 bacterial taxa tested in the “seasons combined” analysis.

Each point represents the estimated percent variance explained (PVE, or “chip heritability”) for the joint effect of all genotypes analyzed in the GWAS for bacterial abundance during the “seasons combined” analyses. Bars indicate standard error measurements around the estimate. A number of bacterial taxa showed non-zero PVE estimates (listed in order from highest to lowest PVE) with error bars that do not intersect zero, indicating that cumulative common genetic variation can explain some portion of the variation in bacterial abundance observed between individuals. Bacterial taxa that also had at least one nominally significant genetic association at a genome-wide association level are labeled in purple, with the level of significance indicated (q ≤ 0.2 or q ≤ 0.1).
