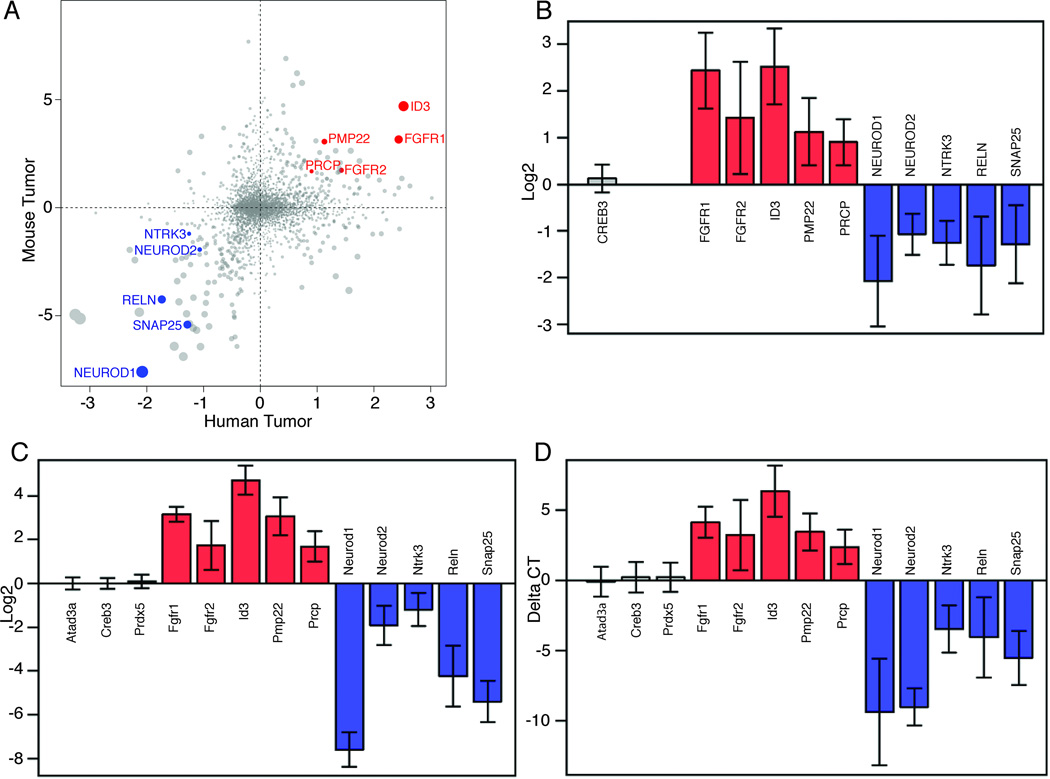
Figure 7. Snf5F/Fp53L/LGFAP-Cre tumors and human AT/RT show similar gene expression signatures.
(A–D) Differential expression analysis of 4,473 genes, which are included in the published Pomeroy human tumor (AT/RT and MB) dataset that have clearly identifiable mouse orthologs, with Snf5F/Fp53L/LGFAP-Cre tumors and mouse MB from Ptch1+/− mice (A). The plot shows the global similarity of AT/RT-MB differential expression between the human and mouse data sets. Each point represents the log2-ratio of mean expression measurements of a single gene. These 2 sets of values are positively correlated. (Pearson’s r = 0.22, p < 10e-16). A set of genes was selected based on this plot to represent AT/RT-specific markers (FGFR1, FGFR2, ID3, PMP22, and PRCP; red dots) and MB-specific markers (NEUROD1, NEUROD2, NTRK3, RELN, SNAP25; blue dots). Comparison on these markers in bar graphs of human data (B) and mouse data (C) indicate they clearly distinguish the two sets of tumors. To validate these results, we used specific probes for qRT-PCR analysis of RNA from Snf5F/Fp53L/LGFAP-Cre tumors and MB from Ptch+/− mice (D). In addition, 3 control genes (Atad3a, Creb3, and Prdx5) that were expressed at the same levels in each tumor type were also examined. The color represents no change (grey bars), AT/RT > medulloblastoma (red bars), and AT/RT < medulloblastoma (blue bars). The error bars represent 95% confidence interval of group difference. The delta cycle threshold (CT) method was used to compute the expression levels of individual genes after data normalization as described below.

